
Here is some data: the last incident your company experienced lasted 54 minutes.
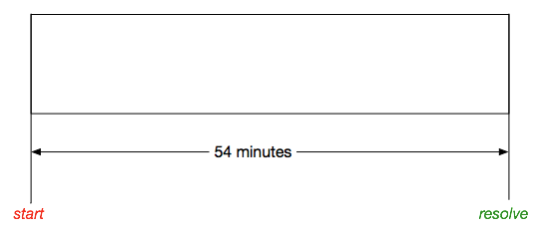
What insight does this data reveal besides a) an incident happened, and b) it lasted 54 minutes (at least according to someone interpreting an event as an incident)? What else could we glean from this data? Hrm.
What if we found that someone marked down when this incident was “detected”?Now we have more data!
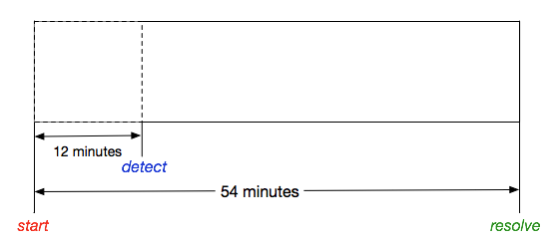
Given this new data, how has our understanding of the incident changed? Hm.
What if we had this data about multiple incidents over some period of time? 
BOOM. Now we have four times more data than we did at the beginning!
But wait – here’s yet even more data — the dates that the incidents happened!
Check it out: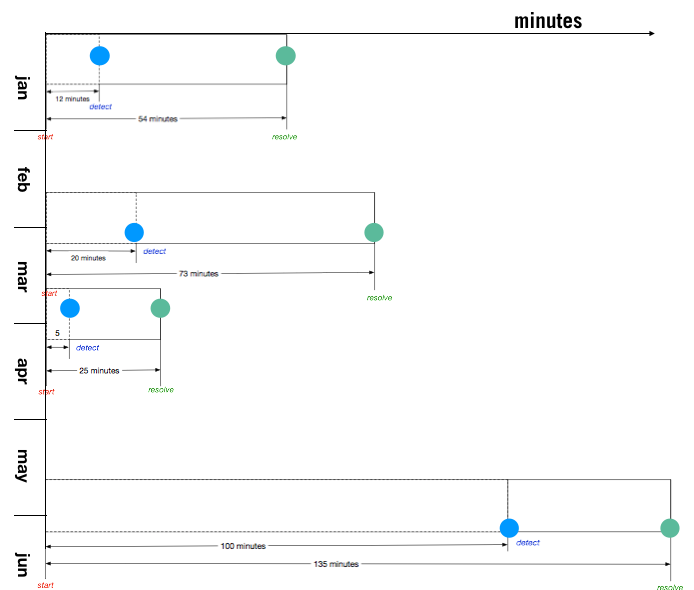 Let’s
Let’s
look at this data in another way: 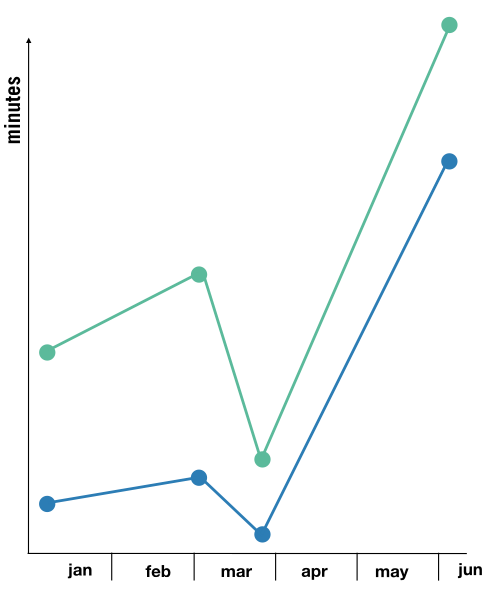
That is a lot of data there, and we’ve plotted it on a chart.
What can we conclude from this data? What does this tell us about our teams? Our systems?Does it tell us anything about how people solve tricky problems?Does it tell us anything about how people work together to figure out what’s happening?Does it tell us anything about how people make plans to understand the problem better?
I’m not sure we have any answers to those questions based on this data. But what if…we calculated the statistical mean of these numbers? Would that help us understand these incidents better?What would calculating the MTTR or MTTD do? Also: should we average them over the six months, or calculate a rolling monthly average, or…?

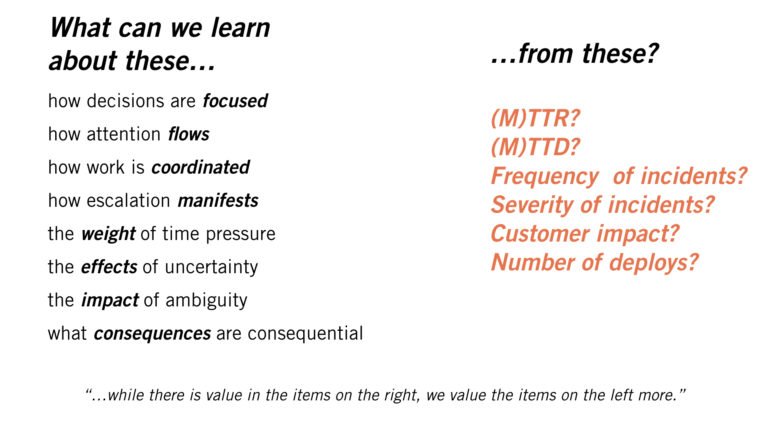
Frequency of incidents.
Time-To-Resolve.
Time-To-Detect.
Severity level of events.
This is valid data about these incidents, but they (and other common measurements around incidents) tend to generate very little insight about these events, or what directions a team or company might take in order to make improvements.
In fact, I believe that the industry as a whole is giving this shallow data much more attention than it warrants. Certainly, filtering this shallow data as means, medians, and other central tendency metrics obscures more about the incidents than it actually reveals.
This is largely because incidents are much more unique than conventional wisdom would have you believe. Two incidents of the same length can have dramatically different levels of surprise and uncertainty in how people came to understand what was happening. They can also contain wildly different risks with respect to taking actions that are meant to mitigate or improve the situation. Incidents are not widgets being manufactured, where limited variation in physical dimensions is seen as key markers of quality.
Incidents are dynamic events with people making decisions under time pressure and insufficient data, and the focus of attention in an incident can change quickly and unexpectedly from one moment to the next.
Using this data as if they were bellwether indicators of how individuals and teams perform under real-world uncertainty and ambiguity of these incidents 1) ignores the experience of the people involved, and 2) demeans the real substance of how these events unfold.
In other words: organizations learn next to nothing from this data alone, and it does not represent what most typically think it does.
Deeper and thicker data is needed to understand and generate insights from incidents
In order to take human performance seriously, we have to acknowledge that this shallow data provides very little guidance that we can use to understand the most critical elements of events.
Instead, we have to acknowledge that questions such as:
- How do people who are in different teams or different domain expertise explain to each other what is familiar and important to watch for during an incident?
- Are there any sources of data about the systems (logs, graphs, etc.) that people regularly dismiss or are suspicious of?
- How do people improvise new tools to help them understand what is happening?
- How do people assess when they need to call for help?
- How does a new person in a team learn the nuances of systems behavior that isn’t documented?
- What do the elder/veteran engineers know about their systems that others don’t? What esoteric knowledge do they have, and how did they get it?
- What tricks do people or teams use to understand how otherwise opaque 3rd party services are behaving?
- Are there specific categories of problems (or particular systems) that trigger engineers to call for assistance from other teams, and others that don’t?
- What sacrifice decisions are people making, and how do they understand the ramifications of making those sacrifice decisions? Do they believe they have authority to halt functionality that could mitigate data loss/corruption, knowing that doing so will undoubtedly produce political or organization blowback?
…are not only critical to understanding the various dynamics and qualities of an incident but are required in order to make substantive efforts to improve their stance in future events.

I believe that the confidence we have in the value of shallow data (TTR/TTD, etc.) stems from a desire to make what is actually very “messy” (the real-world evolution and handling of these events) into neater and more orderly (read: simpler to understand) categories, buckets, and signals.
In that way, we could view our confidence in this shallow data as just a coping strategy for dealing with the complex stuff that incidents are made of in the real world.
If you were to look just a bit deeper into your incidents, you’d notice that reality is not as neat and orderly as we want them to be:
- Sometimes, an incident can be detected after the event has actually resolved.
- Sometimes, the perceived severity of an incident can change as it progresses, in both directions. What was initially thought to be really critical can later turn out to be not nearly as important as originally thought – and vice versa!
- In other incidents, an issue might be detected but deemed to be not critical enough to warrant attention, only watching for indications that it’s worsening.
- In some incidents, a team can detect that something untoward is happening but not have a good way to identify what the problem actually is. Other times, problem detection and problem identification can happen almost simultaneously.
- Sometimes, people can take actions that are confidently intended to fix a problem (or make it less impactful than it otherwise would be) but as a result, worsen the problem.
- Sometimes, engineers can get bitten by strange loop phenomena; the thing you need to fix the problem is the thing that is also broken.
- Sometimes, people need to call for help because they either can’t generate hypotheses or any plausible explanations for the behavior that they’re seeing.
- Other times, generating hypotheses about a problem isn’t an issue, but people need to call for help on what to do based on a hypothesis chosen.
- Sometimes, contributing factors to an incident are so beyond anyone’s imagination that actions are taken based not on hypotheses but out of desperation; getting the system to do anything different than what it’s been doing can be seen as progress.
Discovering and exploring this sort of data is more time consuming, difficult to do well, and takes more effort than recording and categorizing shallow data about incidents. Incidents are unplanned investments. When you focus solely on shallow data you are giving up the return on those investments that you can realize by deeper and more elaborate analysis.

Just because the software industry isn’t familiar with the methods, approaches, and techniques to explore incidents in deeper and more elaborate ways doesn’t mean it can’t learn them and demonstrate significant progress by doing so.
This past week I spoke at the Pipeline Conference in London, and summarized this assertion this way:
This is why we started Adaptive Capacity Labs: to demonstrate that meaningful insight comes from studying how real people do real work under real conditions.
Does your company rely on shallow data like above? What investments in deeper analytical methods have they made? Take a look at what we do to assess your company’s capacity to learn in these ways.
References:
Allspaw J. (2015) Trade-Offs Under Pressure: Heuristics And Observations Of Teams Resolving Internet Service Outages. Masters Thesis. Lund, Sweden: Lund University.